Multiple Choice
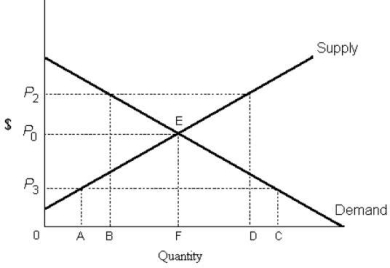 FIGURE 5- 1
-Refer to Figure 5- 1. If the diagram applies to the labour market, and P3 represents a legislated minimum wage,
A) the labour market is in disequilibrium.
B) the amount of labour employed will rise from quantity F to quantity C.
C) there will be excess demand of AC in the labour market.
D) there will be unemployment of AC in the labour market.
E) the free- market equilibrium wage is P0 and the labour market is unaffected by the minimum wage.
Correct Answer:

Verified
Correct Answer:
Verified
Q96: With respect to some commodity, X, if
Q97: An excess supply of some product is
Q98: <span class="ql-formula" data-value="\text { Demand and Supply
Q99: One measure of market inefficiency is<br>A) the
Q100: Each point on a demand curve shows
Q102: Partial- equilibrium analysis considers<br>A) all markets simultaneously,
Q103: A binding minimum wage established by the
Q104: A legal price ceiling, if it is
Q105: Which of the following statements best differentiates
Q106: <span class="ql-formula" data-value="\text { Demand and Supply