Multiple Choice
The diagram below shows the market for apartments in a city. Assume that all apartments are identical. 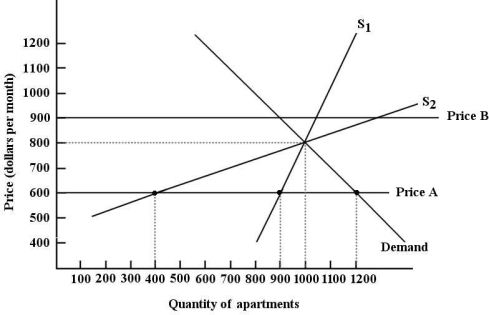 FIGURE 5- 4
-Refer to Figure 5- 4. Suppose the government imposes a rent- controlled price of $600 per month on apartments in this city. In the short run we can expect the shortage of apartments to be units.
A) 300
B) 200
C) 1000
D) 0
E) 800
Correct Answer:

Verified
Correct Answer:
Verified
Q50: Consider the market for pulp and paper.
Q51: A legal price floor is a<br>A) price
Q52: <img src="https://d2lvgg3v3hfg70.cloudfront.net/TB5438/.jpg" alt=" FIGURE 5- 5
Q53: If the equilibrium price for some product
Q54: <img src="https://d2lvgg3v3hfg70.cloudfront.net/TB5438/.jpg" alt=" FIGURE 5- 5
Q56: Which of the following is true of
Q57: The shortage of housing that exists in
Q58: Suppose a binding output quota is imposed
Q59: <img src="https://d2lvgg3v3hfg70.cloudfront.net/TB5438/.jpg" alt=" FIGURE 5- 1
Q60: Output quotas are commonly used in markets