Multiple Choice
The diagram below shows the market for apartments in a city. Assume that all apartments are identical. 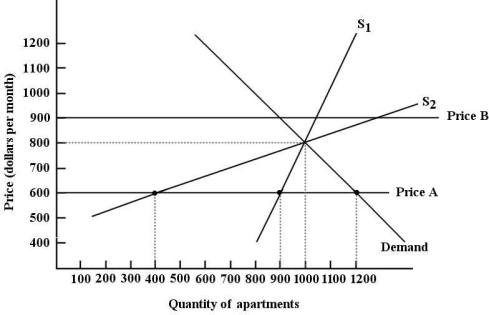 FIGURE 5- 4
-Refer to Figure 5- 4. The difference between supply curve S1 and supply curve S2 in this market for apartments is that
A) S1 is not affected by a government controlled rental price.
B) S2 is not affected by a government controlled rental price.
C) S1 is a short- run supply curve and S2 is a long- run supply curve.
D) S1 is a long- run supply curve and S2 is a short- run supply curve.
E) S1 is more elastic than S2.
Correct Answer:

Verified
Correct Answer:
Verified
Q103: A binding minimum wage established by the
Q104: A legal price ceiling, if it is
Q105: Which of the following statements best differentiates
Q106: <span class="ql-formula" data-value="\text { Demand and Supply
Q107: A legally imposed upper limit on a
Q109: <img src="https://d2lvgg3v3hfg70.cloudfront.net/TB5438/.jpg" alt=" FIGURE 5- 5
Q110: The price of a good or a
Q111: If the equilibrium price for some product
Q112: General- equilibrium analysis considers<br>A) how government planning
Q113: If 10 000 snow tires are produced