Multiple Choice
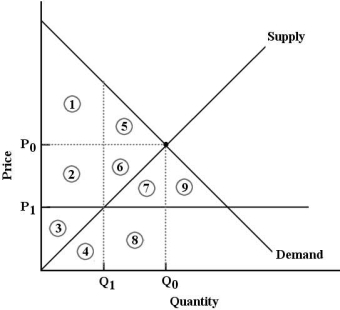 FIGURE 5- 6
-Refer to Figure 5- 6. The market for good X is in equilibrium at P0 and Q0. Economic surplus is represented by
A) areas 2, 3, 4, 6, 7, 8.
B) areas 1, 2, 3, 5, 6.
C) areas 2, 3, 4, 6, 7, 8, 9.
D) areas 1 and 5.
E) areas 1, 2, 3, 4, 5, 6, 7, 8.
Correct Answer:

Verified
Correct Answer:
Verified
Q89: Each point on a supply curve shows
Q90: Consider the following demand and supply
Q91: In competitive markets, price floors and price
Q92: <img src="https://d2lvgg3v3hfg70.cloudfront.net/TB5438/.jpg" alt=" FIGURE 5- 3
Q93: An excess demand for some product is
Q95: <img src="https://d2lvgg3v3hfg70.cloudfront.net/TB5438/.jpg" alt=" FIGURE 5- 1
Q96: With respect to some commodity, X, if
Q97: An excess supply of some product is
Q98: <span class="ql-formula" data-value="\text { Demand and Supply
Q99: One measure of market inefficiency is<br>A) the