Multiple Choice
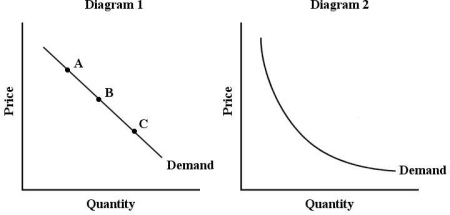 FIGURE 4- 1
-Refer to Figure 4- 1, which shows two demand curves, one linear and the other a rectangular hyperbola. In diagram 1, the price elasticity of demand
A) at point A is equal to that at point C.
B) is equal at points A, B, and C.
C) at point A is greater than at point C.
D) at point A is less than at point C.
E) at point A is equal to that at point B.
Correct Answer:

Verified
Correct Answer:
Verified
Q45: Suppose the cross- elasticity of demand for
Q46: If the price elasticity of demand is
Q47: A value of zero for the elasticity
Q48: <img src="https://d2lvgg3v3hfg70.cloudfront.net/TB5438/.jpg" alt=" FIGURE 4- 3
Q49: The formula for the own- price
Q51: Suppose the supply curve for breakfast cereals
Q52: If the total expenditure on automobiles increases
Q53: <img src="https://d2lvgg3v3hfg70.cloudfront.net/TB5438/.jpg" alt=" FIGURE 4- 2
Q54: A perfectly horizontal demand curve shows that
Q55: Consider two demand curves and the same