Multiple Choice
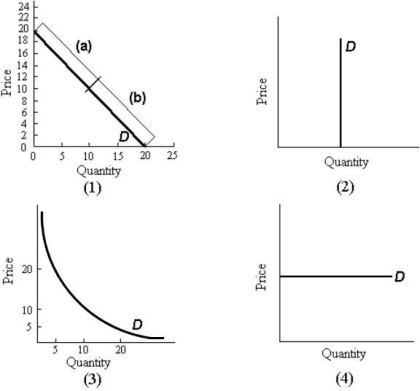 FIGURE 4- 2
-Refer to Figure 4- 2. In part 3 of the figure, the elasticity of demand between prices $5 and $10 is
A) 0.
B) less than 1.
C) exactly 1.
D) greater than 1.
E) infinity.
Correct Answer:

Verified
Correct Answer:
Verified
Q5: <span class="ql-formula" data-value="\begin{array}{l}\text { Demand Schedule for
Q6: <img src="https://d2lvgg3v3hfg70.cloudfront.net/TB5438/.jpg" alt=" FIGURE 4- 2
Q7: When national income falls, sales of vacation
Q9: The price elasticity of demand for a
Q11: The imposition of an excise tax usually
Q12: The table below shows the demand
Q13: Suppose that the quantity demanded of skipping
Q14: The "economic incidence" of an excise tax
Q15: Price elasticity of demand<br>A) usually increases over
Q61: <img src="https://d2lvgg3v3hfg70.cloudfront.net/TB5441/.jpg" alt=" FIGURE 4-2 -Refer