Multiple Choice
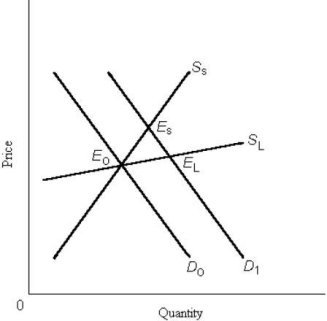 FIGURE 4- 3
-Refer to Figure 4- 3. The diagram shows a rightward shift in the demand curve for some good, and the short- run and long- run supply curves (SS and SL, respectively) . In the new short- run equilibrium after the increase in demand, producers' revenue
A) could be higher or lower than at E0, depending on the short- run elasticity of supply.
B) is unambiguously lower than at E0.
C) is unambiguously higher than at E0.
D) is unambiguously higher than at EL.
E) is unambiguously lower than in the long- run equilibrium at EL.
Correct Answer:

Verified
Correct Answer:
Verified
Q20: If per capita income increases by 10
Q21: If the income elasticity of demand for
Q22: Suppose the cross- elasticity of demand between
Q23: For an inferior good, the quantity demanded<br>A)
Q24: We can expect that the income elasticity
Q26: Suppose national income is rising steadily at
Q27: Consider the following data for a
Q28: The price elasticity of demand measures the
Q29: Which of the following statements would you
Q30: Which of the following tends to be