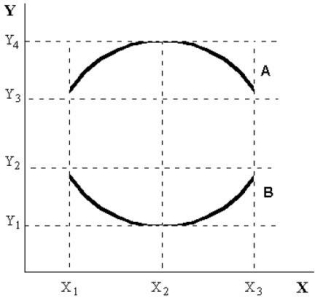
menu-iconExamlexExamLexServices

Discover

Ask a Question
  1. All Topics
  2. Topic
    Business
  3. Study Set
    Microeconomics Study Set 29
  4. Exam
    Exam 2: Economic Theories, Data, and Graphs
  5. Question
    FIGURE 2- 3 -Refer to Figure 2- 3. at X2 on Curve a on Curve
Solved

FIGURE 2- 3 -Refer to Figure 2- 3. at X2 on Curve a on Curve

Question 95

Question 95

Multiple Choice

  FIGURE 2- 3 -Refer to Figure 2- 3. At X2 on curve A , the A)  minimum occurs at Y4. B)  slope is increasing. C)  maximum occurs at Y1. D)  slope of the curve is zero. E)  slope is decreasing. FIGURE 2- 3
-Refer to Figure 2- 3. At X2 on curve A , the


A) minimum occurs at Y4.
B) slope is increasing.
C) maximum occurs at Y1.
D) slope of the curve is zero.
E) slope is decreasing.

Correct Answer:

verifed

Verified

Unlock this answer now
Get Access to more Verified Answers free of charge

Related Questions

Q4: If Y is an increasing function of

Q22: When an increase in one variable is

Q25: The scientific approach to economic inquiry involves<br>A)testing

Q58: Negatively related variables change such that as

Q66: On a coordinate graph, what is the

Q72: An economic theory<br>A)will be useful only if

Q89: A valid theory<br>A)extrapolates from the past behaviour

Q90: What is the best way to display

Q91: If the graph of a function is

Q93: <img src="https://d2lvgg3v3hfg70.cloudfront.net/TB5438/.jpg" alt=" FIGURE 2- 2

Examlex

ExamLex

About UsContact UsPerks CenterHomeschoolingTest Prep

Work With Us

Campus RepresentativeInfluencers

Links

FaqPricingChrome Extension

Download The App

Get App StoreGet Google Play

Policies

Privacy PolicyTerms of ServiceHonor CodeCommunity Guidelines

Scan To Download

qr-code

Copyright © (2025) ExamLex LLC.

Privacy PolicyTerms Of ServiceHonor CodeCommunity Guidelines