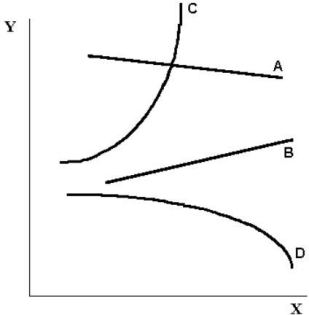
menu-iconExamlexExamLexServices

Discover

Ask a Question
  1. All Topics
  2. Topic
    Business
  3. Study Set
    Microeconomics Study Set 29
  4. Exam
    Exam 2: Economic Theories, Data, and Graphs
  5. Question
    FIGURE 2- 2 -Refer to Figure 2- 2. the Slope of Curve D
Solved

FIGURE 2- 2 -Refer to Figure 2- 2. the Slope of Curve D

Question 55

Question 55

Multiple Choice

  FIGURE 2- 2 -Refer to Figure 2- 2. The slope of curve D is A)  positive and constant. B)  undefined. C)  negative and constant. D)  positive and changing. E)  negative and changing. FIGURE 2- 2
-Refer to Figure 2- 2. The slope of curve D is


A) positive and constant.
B) undefined.
C) negative and constant.
D) positive and changing.
E) negative and changing.

Correct Answer:

verifed

Verified

Unlock this answer now
Get Access to more Verified Answers free of charge

Related Questions

Q1: Data collected of several variables but for

Q3: The statement that a country's rate of

Q5: When an increase in one variable is

Q21: Economic theories<br>A)can be used to help explain

Q50: Let 1 stand for "any given

Q52: In a co- ordinate graph, with Y

Q52: Consider the following equation: Y = 10

Q54: Suppose that two points on a straight

Q85: An economist collects data comparing per- capita

Q88: On a coordinate graph, what is the

Examlex

ExamLex

About UsContact UsPerks CenterHomeschoolingTest Prep

Work With Us

Campus RepresentativeInfluencers

Links

FaqPricingChrome Extension

Download The App

Get App StoreGet Google Play

Policies

Privacy PolicyTerms of ServiceHonor CodeCommunity Guidelines

Scan To Download

qr-code

Copyright © (2025) ExamLex LLC.

Privacy PolicyTerms Of ServiceHonor CodeCommunity Guidelines