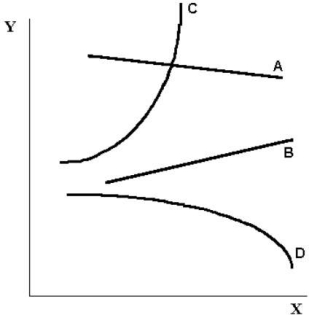
menu-iconExamlexExamLexServices

Discover

Ask a Question
  1. All Topics
  2. Topic
    Business
  3. Study Set
    Microeconomics Study Set 29
  4. Exam
    Exam 2: Economic Theories, Data, and Graphs
  5. Question
    FIGURE 2- 2 -Refer to Figure 2- 2. the Slope of Curve C
Solved

FIGURE 2- 2 -Refer to Figure 2- 2. the Slope of Curve C

Question 104

Question 104

Multiple Choice

  FIGURE 2- 2 -Refer to Figure 2- 2. The slope of curve C is A)  negative and constant. B)  negative and changing. C)  impossible to describe. D)  positive and constant. E)  positive and changing. FIGURE 2- 2
-Refer to Figure 2- 2. The slope of curve C is


A) negative and constant.
B) negative and changing.
C) impossible to describe.
D) positive and constant.
E) positive and changing.

Correct Answer:

verifed

Verified

Unlock this answer now
Get Access to more Verified Answers free of charge

Related Questions

Q12: At the minimum or the maximum of

Q17: When an economist assumes that the owners

Q32: Suppose we have data for 1000 students

Q48: An economic hypothesis will be rejected when<br>A)the

Q66: On a coordinate graph, what is the

Q71: An economist has data showing household income

Q73: Suppose we observe that consumption of electricity

Q77: Suppose that a particular theory predicts that

Q80: An economic theory requires, among other things,<br>A)a

Q89: A valid theory<br>A)extrapolates from the past behaviour

Examlex

ExamLex

About UsContact UsPerks CenterHomeschoolingTest Prep

Work With Us

Campus RepresentativeInfluencers

Links

FaqPricingChrome Extension

Download The App

Get App StoreGet Google Play

Policies

Privacy PolicyTerms of ServiceHonor CodeCommunity Guidelines

Scan To Download

qr-code

Copyright © (2025) ExamLex LLC.

Privacy PolicyTerms Of ServiceHonor CodeCommunity Guidelines