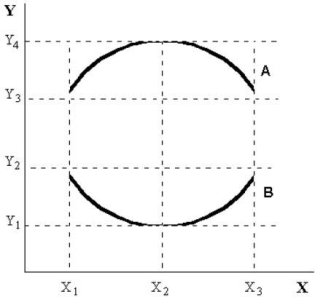
menu-iconExamlexExamLexServices

Discover

Ask a Question
  1. All Topics
  2. Topic
    Business
  3. Study Set
    Microeconomics Study Set 29
  4. Exam
    Exam 2: Economic Theories, Data, and Graphs
  5. Question
    FIGURE 2- 3 -Refer to Figure 2- 3. on Curve A, the Maximum
Solved

FIGURE 2- 3 -Refer to Figure 2- 3. on Curve A, the Maximum

Question 14

Question 14

Multiple Choice

  FIGURE 2- 3 -Refer to Figure 2- 3. On curve A, the maximum value of Y occurs at A)  X1. B)  values of X greater than X3. C)  X2. D)  X3. E)  X = 0. FIGURE 2- 3
-Refer to Figure 2- 3. On curve A, the maximum value of Y occurs at


A) X1.
B) values of X greater than X3.
C) X2.
D) X3.
E) X = 0.

Correct Answer:

verifed

Verified

Unlock this answer now
Get Access to more Verified Answers free of charge

Related Questions

Q9: <img src="https://d2lvgg3v3hfg70.cloudfront.net/TB5438/.jpg" alt=" FIGURE 2- 2

Q19: The table below shows hypothetical tuition

Q23: A hypothesis (or a prediction)is a statement

Q26: The use of statistics in economics is<br>A)to

Q27: Disagreements over positive statements<br>A)are basically devoid of

Q31: Choose the answer that best explains why

Q34: Suppose a theory predicts that lowering tuition

Q50: If a theory's prediction is tested and

Q54: The mathematical expression of a relationship between

Q74: The statement that a country's rate of

Examlex

ExamLex

About UsContact UsPerks CenterHomeschoolingTest Prep

Work With Us

Campus RepresentativeInfluencers

Links

FaqPricingChrome Extension

Download The App

Get App StoreGet Google Play

Policies

Privacy PolicyTerms of ServiceHonor CodeCommunity Guidelines

Scan To Download

qr-code

Copyright © (2025) ExamLex LLC.

Privacy PolicyTerms Of ServiceHonor CodeCommunity Guidelines