Essay
The figure below shows the relationship of the quantity demanded for iTune music downloads per day to the price of each iTune music download. 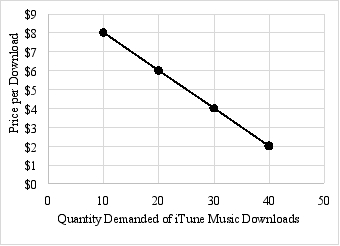 (A) If the price of iTune music dommlaats increases fram 12 per dommaad to 14 per domidaad by how much will the quantity demanded for iTune music dowrloads change?
(B) Eolnan how yaur anser in part (A) relies on the ceteris paribm assumption.
Correct Answer:

Verified
(A)The number of iTune music downloads w...View Answer
Unlock this answer now
Get Access to more Verified Answers free of charge
Correct Answer:
Verified
View Answer
Unlock this answer now
Get Access to more Verified Answers free of charge
Q47: Because economists have varying moral beliefs and
Q53: All microeconomic issues are normative in nature.
Q84: Identify whether the following issues are macroeconomic
Q85: Indicate whether you expect positive or negative
Q86: Exhibit 2A-3 <img src="https://d2lvgg3v3hfg70.cloudfront.net/TB6906/.jpg" alt="Exhibit 2A-3
Q94: Causation<br>A)occurs when there is no correlation between
Q114: Exhibit 2A-2 <img src="https://d2lvgg3v3hfg70.cloudfront.net/TB6906/.jpg" alt="Exhibit 2A-2
Q122: Those who support a laissez faire system<br>A)believe
Q133: "Inflation is a more serious problem than
Q141: Karl Marx argued that capitalism would eventually