Multiple Choice
The graph in Figure 17-18 shows the time course of the polymerization of pure tubulin in vitro.Assume that the starting concentration of free tubulin is higher than it is in cells. 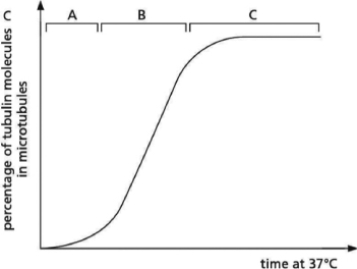 Figure 17-18
Three parts of the curve are labeled above it as A, B, and C.You conduct a similar in vitro tubulin-polymerization experiment, only this time you include purified centrosomes in your preparation.When you plot your data, which part of your graph should be most dissimilar to the curve shown in Figure 17-18?
A) A
B) B
C) C
D) None.The shape of my graph should be identical to the graph produced when tubulin is polymerized in the absence of purified centrosomes.
Correct Answer:

Verified
Correct Answer:
Verified
Q18: Your friend works in a biotech company
Q19: You are studying nuclear lamins and use
Q20: Figure 17-31 shows the leading edge of
Q21: Which of the following items is not
Q22: The graph in Figure 17-10 shows the
Q24: Indicate whether each of the following statements
Q25: Phosphorylation of nuclear lamins regulates their assembly
Q26: Which of the following statements about the
Q27: Which of the following statements about the
Q28: Which of the following statements about the