Multiple Choice
 The scatter diagram above shows the actual data for the price and quantity demanded of a product.
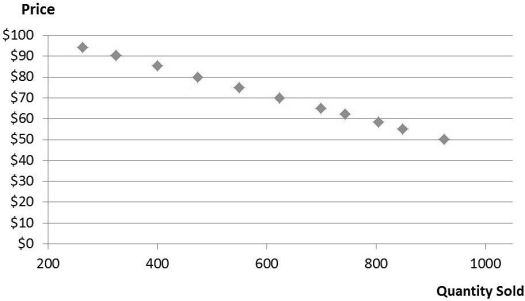
-Refer to the scatter diagram above. The diagram suggests which of the following?
A) The true demand is likely to be linear it the natural logarithms.
B) The estimated demand curve will have a positive slope.
C) A straight- line demand curve will likely be the best fit.
D) A nonlinear demand curve will likely be the best fit.
Correct Answer:

Verified
Correct Answer:
Verified
Q81: <img src="https://d2lvgg3v3hfg70.cloudfront.net/TB1687/.jpg" alt=" The table above
Q82: <img src="https://d2lvgg3v3hfg70.cloudfront.net/TB1687/.jpg" alt=" The table above
Q83: You are the owner of a firm
Q84: Economists have defined the price elasticity of
Q85: You are the owner of a construction
Q87: <img src="https://d2lvgg3v3hfg70.cloudfront.net/TB1687/.jpg" alt=" The table above
Q88: Using Excel, Best Paints estimates the log-
Q89: If Excel estimated the 95 percent confidence
Q90: You are the owner of a restaurant
Q91: If Excel estimates the demand function for