Multiple Choice
 The scatter diagram above shows the actual data for the price and quantity demanded of a product.
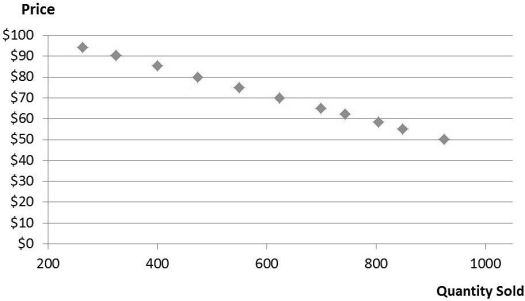
-Refer to the scatter diagram above. The scatter diagram suggests all of the following, except which one?
A) The R2 is likely to be greater when an nonlinear demand curve is estimated compared to a straight- line demand curve.
B) The estimated demand will have a negative slope.
C) A straight- line demand curve is likely to be a better fit to the actual data compared to a nonlinear demand curve.
D) The R2 is likely to be greater when a straight- line demand curve is estimated compared to a nonlinear demand curve.
Correct Answer:

Verified
Correct Answer:
Verified
Q13: Using Excel, the manager of Quick Breaks
Q14: If a 5 percent increase in consumer
Q15: When reviewing reports based on a regression
Q16: A linear demand curve is a constant
Q17: If the R2 is large, you are
Q19: If the P- value for an estimated
Q20: A nonlinear demand curves have positive slope.
Q21: Consider a 15 percent increase in the
Q22: All of the following are true regarding
Q23: Big Poppa's BBQ Sandwiches is a local