Multiple Choice
Figure 20-1
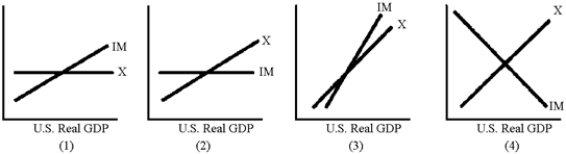
-Which of the graphs in Figure 20-1 best illustrates the behavior of exports and imports in relation to U.S.real GDP?
A) 1
B) 2
C) 3
D) 4
Correct Answer:

Verified
Correct Answer:
Verified
Related Questions
Q4: A currency appreciation should<br>A)reduce net exports and
Q11: Expansionary fiscal policy in an open economy<br>A)leads
Q16: A favorable supply shock abroad would<br>A)increase U.S.imports
Q96: In the 1990s, the United States eliminated
Q103: The worst remedy for curing the U.S.trade
Q106: If Mexico experiences a period of stable
Q115: Appreciation of the Japanese Yen would lead
Q130: Assume that Country X and Country Y
Q177: A decline in interest rates tends to
Q183: A sizable appreciation of the U.S.dollar in