Multiple Choice
Figure 19-2
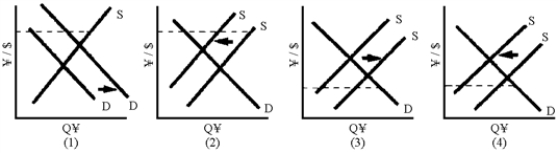
-Of the graphs in Figure 19-2, which one shows the effects on the exchange rate of an expansion in Japan?
A) 1
B) 2
C) 3
D) 4
Correct Answer:

Verified
Correct Answer:
Verified
Related Questions
Q8: If interest rates in the United States
Q9: In 2001, the Argentine peso was overvalued
Q10: Under a gold standard, a discovery of
Q11: Exchange rates determined by the forces of
Q14: The current exchange rate system for most
Q15: The Bretton Woods agreements in 1944<br>A)established the
Q16: Why did the Bretton Woods system ultimately
Q17: An economic boom in America should increase
Q18: In a floating exchange market, the exchange
Q79: The exchange rate states the price, in