Multiple Choice
Figure 10-3
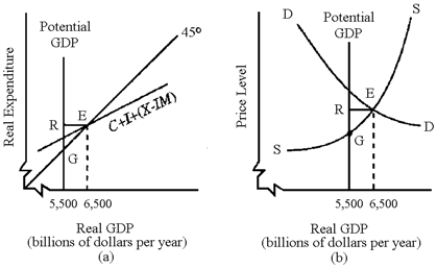
-In Figure 10-3, both graphs (a) and (b) indicate that the economy is experiencing a(n)
A) recessionary gap of RE.
B) recessionary gap of RG.
C) inflationary gap of RG.
D) inflationary gap of RE.
Correct Answer:

Verified
Correct Answer:
Verified
Q141: As long as the aggregate supply curve
Q142: Inflationary GDP is the amount by which
Q143: Productivity is the amount of output produced
Q144: The existence of an inflationary gap or
Q145: When inflation occurs, net exports will<br>A)increase as
Q147: Recessionary gap arises when<br>A)inventory stock falls.<br>B)government spending
Q148: The principal way in which an economy
Q149: A higher expected price level would shift
Q150: Self-correcting mechanism reveals that<br>A)real wages will increase
Q151: The recessions of the 1970s are often