Multiple Choice
Figure 10-6
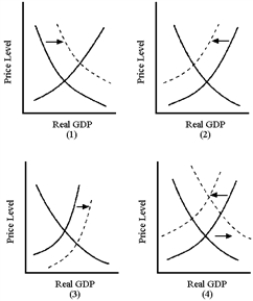
-In Figure 10-6, which graph best illustrates an autonomous increase in consumption spending?
A) (1)
B) (2)
C) (3)
D) (4)
Correct Answer:

Verified
Correct Answer:
Verified
Related Questions
Q10: A decrease in the nominal wage will
Q11: Higher wages mean higher production costs and
Q12: Recessionary gaps are associated with output below
Q13: A recession can be expected to reduce
Q14: Educational reforms that result in improved reading
Q16: The aggregate supply curve is shifted to
Q17: The aggregate supply curve will shift to
Q18: Over time, aggregate demand and aggregate supply
Q19: Assume an economy with an upward-sloping aggregate
Q20: The Japanese economy has been consistently weak