Multiple Choice
Figure 10-7
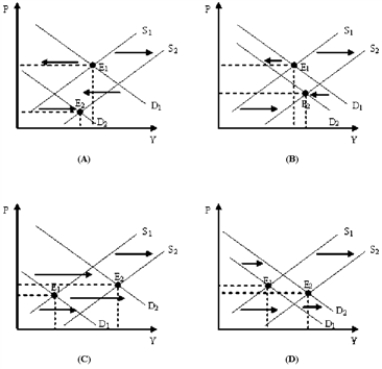
-Refer to Figure 10-7.Which of the diagrams in Figure 10-7 represents a period of economic growth and inflation?
A) Panel (A)
B) Panel (B)
C) Panel (C)
D) Panel (D)
Correct Answer:

Verified
Correct Answer:
Verified
Related Questions
Q3: Like the supply curve for individual goods
Q22: Profit per unit can be expressed as
Q87: For most firms in the economy, the
Q91: If aggregate quantity demanded exceeds aggregate quantity
Q117: A recessionary gap exists when aggregate demand
Q126: The aggregate supply curve shows the relationship
Q129: The 2006-2008 period can be accurately described
Q130: Which of the following events will lead
Q131: "Stagflation" refers to the unwelcome combination of<br>A)inflation
Q132: For a given growth rate in aggregate