Multiple Choice
Figure 8-2
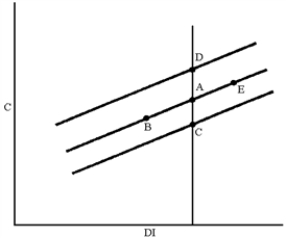
-In Figure 8-2, which of the following moves can be explained by a decrease in the prices of stock on the NASDAQ?
A) A to B
B) A to C
C) A to D
D) A to E
Correct Answer:

Verified
Correct Answer:
Verified
Related Questions
Q206: Aggregate demand is a _ rather than
Q207: Government spending is a leakage out of
Q208: The sum of wages and salaries, interest,
Q209: Figure 8-2<br> <img src="https://d2lvgg3v3hfg70.cloudfront.net/TB8592/.jpg" alt="Figure 8-2
Q210: We should expect the consumption function to
Q211: Bank accounts and bonds are examples of
Q212: "Men are disposed, as a rule, and
Q213: Government purchases are included in national product.
Q214: A decrease in disposable income causes a
Q215: The slope of the scatter diagram representing