Multiple Choice
Figure 4-6
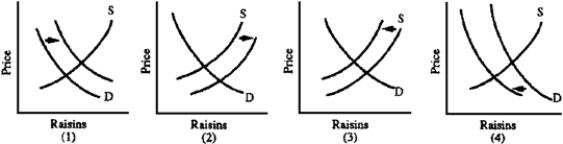
-Grapes can be used for wine or for raisins.Which graph in Figure 4-6 best depicts the effects on the U.S.raisin market of a decrease in purchases of domestic wines?
A) 1
B) 2
C) 3
D) 4
Correct Answer:

Verified
Correct Answer:
Verified
Q19: Two studies published in the New England
Q54: The laws of supply and demand did
Q109: Figure 4-15<br> <img src="https://d2lvgg3v3hfg70.cloudfront.net/TB2282/.jpg" alt="Figure 4-15
Q110: A supply curve can be thought of
Q111: The price for labor is the wage
Q111: Since rent controls have been in effect
Q115: Figure 4-16<br> <img src="https://d2lvgg3v3hfg70.cloudfront.net/TB2282/.jpg" alt="Figure 4-16
Q137: George Washington's troops at Valley Forge were
Q236: Along a supply curve,<br>A)supply changes as price
Q240: "Demand" is a series of quantities demanded,