Multiple Choice
 Use the figure above to answer the following question
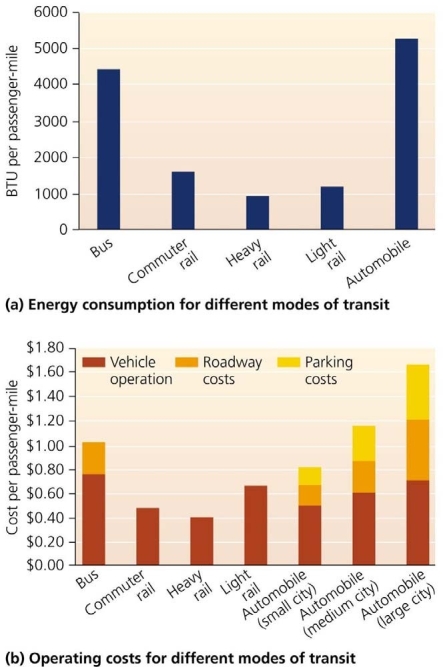
-According to the graphs, the energy consumption per passenger mile __________
A) is more than twice as high for automobiles as it is for any other form of transportation
B) continues to increase for all types of transit
C) is only half as high for bus riders as it is for people in cars
D) is higher for all types of road use than it is for rail use
E) rises as you get farther from the city center
Correct Answer:

Verified
Correct Answer:
Verified
Q14: Over the past 50 years, most U.S.
Q15: <img src="https://d2lvgg3v3hfg70.cloudfront.net/TB6348/.jpg" alt=" Use the figure
Q16: Read the following scenario and answer the
Q17: Then, in 2010, Metro Portland made a
Q18: The urban heat island effect is caused
Q20: Choose the item that best matches each
Q21: Choose the item that best matches each
Q22: The practice of classifying areas for different
Q23: Read the following scenario and answer the
Q24: Oregonʹs strong policy of enforcing UGBʹs (urban