Multiple Choice
The population shown in the graph is demonstrating: 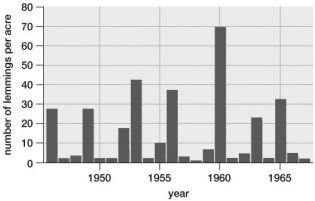
A) a typical boom-and-bust pattern.
B) clumped distribution.
C) an S-curve growth pattern.
D) exponential growth.
E) logistic population growth.
Correct Answer:

Verified
Correct Answer:
Verified
Related Questions
Q3: What is the term for regular population
Q9: What factors determine Earthʹs carrying capacity for
Q59: Malthus's prediction that our human population would
Q61: Exponential growth occurs when:<br>A)the number of births
Q62: The sum of all factors that limit
Q65: A random population distribution:<br>A)is an advantage in
Q66: When a new population stabilizes at the
Q67: Environmental resistance may limit the size of
Q68: What happened to the forests of Easter
Q69: The growth rate of a population is