Multiple Choice
The graph represents a position function. Determine what is happening to the velocity at t = 1. 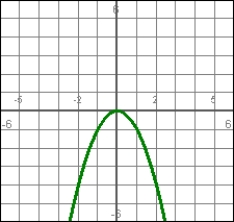
A) It is negative
B) It is positive
C) It is zero
D) There is insufficient information to tell.
E) It is +
Correct Answer:

Verified
Correct Answer:
Verified
Related Questions
Q54: Use a graphing utility to generate the
Q55: If f(x) = (x -4)<sup>4</sup> + 7
Q56: Find the relative extrema for <img src="https://d2lvgg3v3hfg70.cloudfront.net/TB6988/.jpg"
Q57: A rectangle is to have an area
Q58: Answer true or false. f(x) = ln
Q60: The graph below depicts the position function
Q61: Sketch the graph of y = x<sup>3</sup>
Q62: Answer true or false. The Mean-Value Theorem
Q63: Sketch the graph of y = x<sup>3</sup>
Q64: Sketch the graph of y = x<sup>3</sup>-48x