True/False
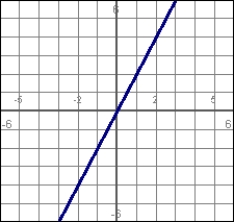
Answer true or false. If the graph on the left is a position function, the graph on the right represents the corresponding velocity function.
y = x2 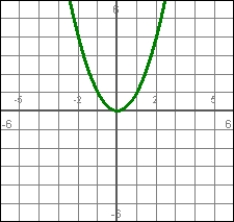
Correct Answer:

Verified
Correct Answer:
Verified
Q134: The graph represents a position function.
Q135: Answer true or false. <img src="https://d2lvgg3v3hfg70.cloudfront.net/TB6988/.jpg" alt="Answer
Q136: If three sides of a trapezoid are
Q137: The position function of a particle
Q138: s(t) = 4t - 3t<sup>2</sup>, t
Q140: Find all relative extrema of f(x) =
Q141: Use a graphing utility to estimate the
Q142: Find the extreme values for <img src="https://d2lvgg3v3hfg70.cloudfront.net/TB6988/.jpg"
Q143: Find the relative extrema for <img src="https://d2lvgg3v3hfg70.cloudfront.net/TB6988/.jpg"
Q144: Use a graphing utility to estimate the