Short Answer
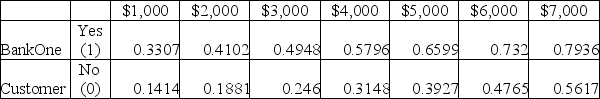
The chart provided shows the probability that a customer will use a coupon offered in a local paper by Lucky Shirts Store. Define the two dependent variables in this chart. How would you determine the odds of a BankOne customer, using the coupon if they annually spend $2,000 at the Store?
Annual Spending at Lucky Shirts Store
Correct Answer:

Verified
Using odds formula, and the ch...View Answer
Unlock this answer now
Get Access to more Verified Answers free of charge
Correct Answer:
Verified
View Answer
Unlock this answer now
Get Access to more Verified Answers free of charge
Q91: What is the natural logarithm of the
Q92: Neural network modeling represents the response variable
Q93: Neural networks have developed due to:<br>A) large
Q94: Since the neural network model employs many
Q95: Review the JMP data in Figure 16.8
Q97: What is a major drawback of the
Q98: Below gives the data concerning (1) the
Q99: Define confidence interval. Is a smaller or
Q100: Define overfitting of data and give an
Q101: If the odds of a student passing