Short Answer
The following frequency table summarizes the ages of 60 shoppers at the local farmer's market.
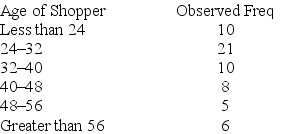 The estimated mean is 36.25, and estimated standard deviation is 13.57. Calculate the probability for each interval, assuming a normal distribution.
Correct Answer:

Verified
 Each probability is determine...
View Answer
Unlock this answer now
Get Access to more Verified Answers free of charge
Correct Answer:
Verified
View Answer
Unlock this answer now
Get Access to more Verified Answers free of charge
Q29: In the past, of all the students
Q30: When we carry out a chi-square test
Q31: A U.S.-based company offers an online proficiency
Q32: A multinomial probability distribution describes data that
Q33: Consider the 3 × 2 contingency table
Q35: When we carry out a chi-square test
Q36: The distance (in thousands of miles) traveled
Q37: The χ<sup>2</sup> statistic from a contingency table
Q38: The χ<sup>2</sup> goodness-of-fit test requires the nominative
Q39: The HR manager of a major office