Short Answer
The following frequency table summarizes the ages of 60 shoppers at the local farmer's market.
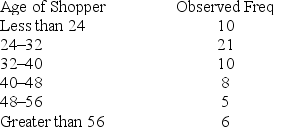 The estimated mean is 36.25, and estimated standard deviation is 13.57. Calculate the expected frequency for each interval, assuming a normal distribution.
Correct Answer:

Verified
 Each expected frequency is n ...
View Answer
Unlock this answer now
Get Access to more Verified Answers free of charge
Correct Answer:
Verified
View Answer
Unlock this answer now
Get Access to more Verified Answers free of charge
Q81: When we carry out a chi-square test
Q82: The distance (in thousands of miles) traveled
Q83: The HR manager of a major office
Q84: Consider the 3 × 2 contingency table
Q85: Consider a set of 50 measurements with
Q87: The following frequency table summarizes the ages
Q88: The chi-square goodness-of-fit test for multinomial probabilities
Q89: Consider a set of 50 measurements with
Q90: A real estate company is analyzing the
Q91: A manufacturing company produces part QV2Y for