Multiple Choice
The following graph of time-series data suggests a _______________ trend. 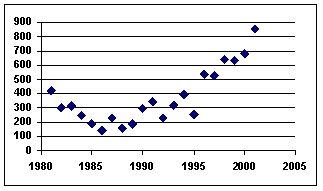

A) linear
B) quadratic
C) cosine
D) tangential
E) flat
Correct Answer:

Verified
Correct Answer:
Verified
Related Questions
Q92: Naïve forecasting models have no useful applications
Q93: When forecasting with exponential smoothing, data from
Q94: A time series analysis was performed
Q95: Autocorrelation in a regression forecasting model can
Q96: Typically, the denominator used to calculate an
Q98: The city golf course is interested
Q99: An exponential smoothing technique in which the
Q100: The city golf course is interested
Q101: A time series with forecast values
Q102: If a researcher is using exponential smoothing