Multiple Choice
The following graph of a time-series data suggests a _______________ trend.
A) linear 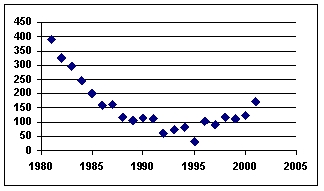
B) tangential
C) cosine
D) quadratic
E) flat
Correct Answer:

Verified
Correct Answer:
Verified
Related Questions
Q68: When constructing a weighted aggregate price index,
Q69: The long-term general direction of data is
Q70: The effect of a four-quarter moving average
Q71: Use of a smoothing constant value greater
Q72: In exponential smoothing models, the value of
Q74: Analysis of data for an autoregressive forecasting
Q75: The motivation for using an index number
Q76: Forecast error is the difference between the
Q77: Analysis of data for an autoregressive forecasting
Q78: Time-series data are data gathered on a