Multiple Choice
The following graph of a time-series data suggests a _______________ trend.
A) linear 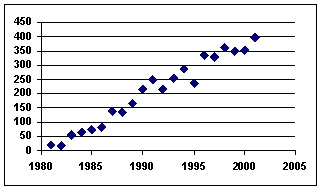
B) quadratic
C) cosine
D) tangential
E) flat
Correct Answer:

Verified
Correct Answer:
Verified
Related Questions
Q38: A small value of the Durbin-Watson statistic
Q39: A time series with forecast values
Q40: The city golf course is interested
Q41: The forecast value for August was
Q42: Jim Royo, Manager of Billings Building
Q44: Autoregression is a multiple regression technique in
Q45: Using 2011 as the base year, the
Q46: Use of a smoothing constant value less
Q47: In statistics, the Winters' Three Parameter statistic
Q48: Using 2011 as the base year, the