menu-iconExamlexExamLexServices

Discover

Ask a Question
  1. All Topics
  2. Topic
    Statistics
  3. Study Set
    Business Statistics
  4. Exam
    Exam 13: Multiple Regression Analysis
  5. Question
    A Multiple Regression Analysis Produced the Following Tables
Solved

A Multiple Regression Analysis Produced the Following Tables

Question 14

Question 14

Multiple Choice

A multiple regression analysis produced the following tables. A multiple regression analysis produced the following tables.   For x<sub>1</sub>= 360 and x<sub>2</sub> = 220, the predicted value of y is ____________. A) 1314.70 B) 1959.71 C) 1077.58 D) 2635.19 E) 2265.57 
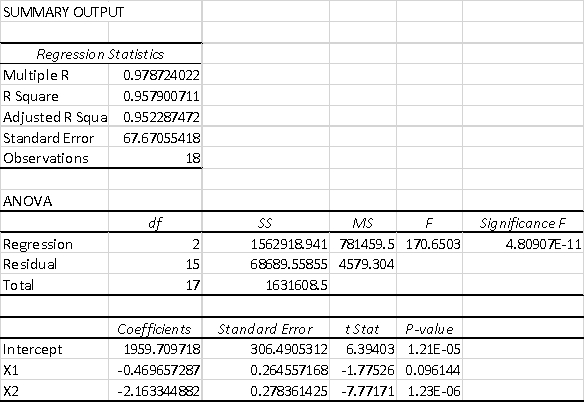
For x1= 360 and x2 = 220, the predicted value of y is ____________.


A) 1314.70
B) 1959.71
C) 1077.58
D) 2635.19
E) 2265.57

Correct Answer:

verifed

Verified

Unlock this answer now
Get Access to more Verified Answers free of charge

Related Questions

Q9: A multiple regression analysis produced the following

Q10: A multiple regression analysis produced the

Q11: A multiple regression analysis produced the

Q12: In regression analysis, outliers may be identified

Q13: The following ANOVA table is from

Q15: In a multiple regression model, the proportion

Q16: A multiple regression analysis produced the

Q17: The following ANOVA table is from

Q18: A multiple regression analysis produced the

Q19: Minitab and Excel output for a multiple

Examlex

ExamLex

About UsContact UsPerks CenterHomeschoolingTest Prep

Work With Us

Campus RepresentativeInfluencers

Links

FaqPricingChrome Extension

Download The App

Get App StoreGet Google Play

Policies

Privacy PolicyTerms of ServiceHonor CodeCommunity Guidelines

Scan To Download

qr-code

Copyright © (2025) ExamLex LLC.

Privacy PolicyTerms Of ServiceHonor CodeCommunity Guidelines