Multiple Choice
According to the following graphic, X and Y have _________. 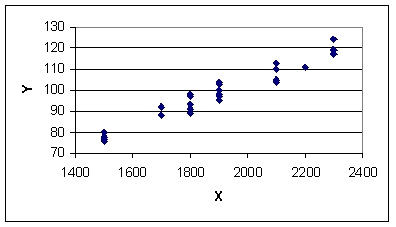
A) strong negative correlation
B) virtually no correlation
C) strong positive correlation
D) moderate negative correlation
E) weak negative correlation
Correct Answer:

Verified
Correct Answer:
Verified
Related Questions
Q39: If there is perfect negative correlation between
Q40: The slope of the regression line, ŷ
Q41: For the following scatter plot and regression
Q42: In the regression equation, ŷ=5.23+2.74x and n=24,
Q43: A manager wishes to predict the annual
Q45: If the coefficient of determination was 0.49,
Q46: A simple regression model resulted in a
Q47: In regression analysis, the predictor variable is
Q48: Louis Katz, a cost accountant at
Q49: The coefficient of determination is the proportion