Multiple Choice
The 2010 and 2012 market share data of three competitors (Alston, Baren, and Clemson) in an oligopolistic industry are presented in the following pie charts. 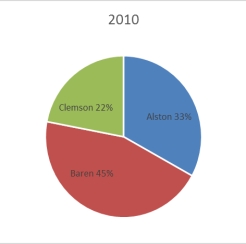
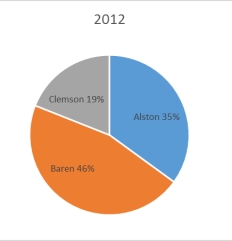 Which of the following is true?
A) Only Baren gained market share.
B) Only Clemson lost market share.
C) Alston lost market share.
D) Baren lost market share.
E) All companies lost market share
Correct Answer:

Verified
Correct Answer:
Verified
Q25: A retail shoe company would like to
Q26: Consider the following frequency distribution:
Q27: The staff of Mr.Wayne Wertz, VP of
Q28: The following is a bar chart of
Q29: Sales are tracked during the past year
Q31: An instructor has decided to graphically represent
Q32: Each day, the manager at Jamie's Auto
Q33: Visualization of time-series data is considered descriptive
Q34: In a frequency distribution, the first class
Q35: The staff of Mr.Wayne Wertz, VP of