Multiple Choice
The following graphic of residential housing data (selling price and size in square feet) indicates _____________. 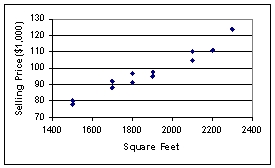
A) an inverse relation between the two variables
B) no relation between the two variables
C) a direct relation between the two variables
D) a negative exponential relation between the two variables
E) a sinusoidal relationship between the two variables
Correct Answer:

Verified
Correct Answer:
Verified
Q58: A cumulative frequency polygon is also called
Q59: One advantage of a stem and leaf
Q60: Consider the following stem and leaf
Q61: Consider the relative frequency distribution given
Q62: Consider the following stem and leaf
Q64: Abel Alonzo, Director of Human Resources,
Q65: Your company is doing market research to
Q66: One rule that must always be followed
Q67: To compare two series of data during
Q68: Each day, the office staff at Oasis