Multiple Choice
A shirt production company has tracked their sales of red and blue shirts over the past few years.The graph of both is shown below. 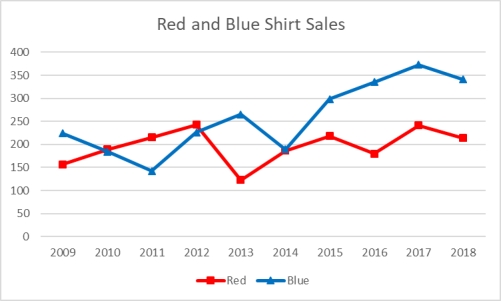 Which of the following is a true statement about the trends in sales?
A) Sales of red shirts are less than those of blue shirts in all the years before 2012.
B) Sales of blue shirts are trending upward from 2014 to 2017.
C) Sales of blue shirts are always higher than those of red shirts.
D) Red shirt sales show an increasing trend.
E) Sales of red shirts are always higher than those of blue shirts.
Correct Answer:

Verified
Correct Answer:
Verified
Q103: Each day, the manager at Jamie's Auto
Q104: For any given data set, a frequency
Q105: The following class intervals for a
Q106: Scott Brim, Chief Financial Officer of
Q107: Consider the following frequency distribution:
Q108: A graphical representation of a frequency distribution
Q109: The staff of Mr.Wayne Wertz, VP of
Q110: Consider the relative frequency distribution given
Q111: The staff of the accounting and the
Q113: Consider a scatterplot showing the relationship between