Multiple Choice
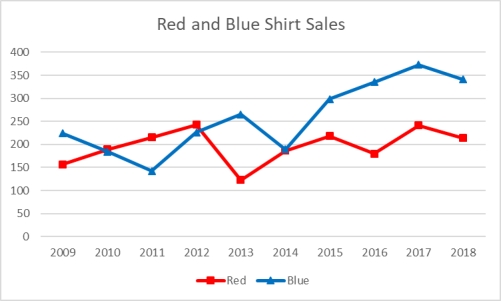
A shirt production company has tracked their sales of red and blue shirts over the past few years.The graph of both is shown below.  In what years were red shirt sales higher than blue shirt sales?
A) 2009 through 2012
B) 2010, 2011, and 2015
C) 2011, 2012, and 2013
D) 2013, 2015, 2016, 2017, and 2018
E) 2010, 2011, and 2012
Correct Answer:

Verified
Correct Answer:
Verified
Q48: A scatter plot is a two-dimensional graph
Q49: The staff of Mr.Wayne Wertz, VP of
Q50: Each day, the office staff at Oasis
Q51: According to the following graphic, the most
Q52: Given two class intervals and their respective
Q54: Time-series data should be shown from oldest
Q55: The number of phone calls arriving
Q56: If the individual class frequency is divided
Q57: Consider the following frequency distribution:
Q58: A cumulative frequency polygon is also called