Essay
Researchers are conducting a review of the "war against poverty" in the latter half of the twentieth century.As part of their analysis,the proportion of Americans under the age of 18 who lived below the poverty line for each of the years 1959 through 2000 is used to generate the following time series plot.
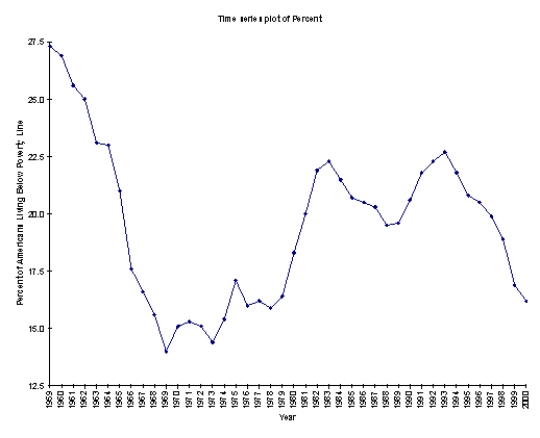 How successful was the United States in its efforts to win "the war against poverty" during the 90's?
Correct Answer:

Verified
Americans were relatively successful in ...View Answer
Unlock this answer now
Get Access to more Verified Answers free of charge
Correct Answer:
Verified
View Answer
Unlock this answer now
Get Access to more Verified Answers free of charge
Q2: The only meaningful way to summarize categorical
Q3: The median can also be described as
Q4: The median of a data set with
Q5: Which of the states listed paid their
Q6: Unlike histograms,box plots depict only one aspect
Q8: A variable (or field or attribute)is a
Q9: Abby has been keeping track of what
Q10: Two common ways of displaying categorical data
Q11: The number of car insurance policy holders
Q12: The core purpose of time series graphs