Essay
The graph pictured below depicts blood glucose changes after eating a meal.The pink line,drawn with square symbols,represents normal variations in glucose levels after a meal.The black line,drawn with diamond symbols,represents levels seen in diabetes mellitus.Differentiate between the normal and abnormal blood glucose levels after a meal and briefly explain the reason for the abnormality. 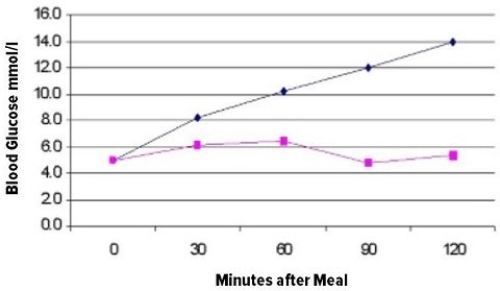
Correct Answer:

Verified
Answers may vary.In the healthy person,b...View Answer
Unlock this answer now
Get Access to more Verified Answers free of charge
Correct Answer:
Verified
View Answer
Unlock this answer now
Get Access to more Verified Answers free of charge
Q10: Which is an example of negative feedback?<br>A)Nursing
Q11: The effects of hyposecretion and hypersecretion of
Q12: Which of the following statements about hormones
Q14: The part of the brain that controls
Q16: The level of sodium in the blood
Q17: Which of the following is NOT a
Q18: Explain why a person will develop a
Q19: Which of the following endocrine glands does
Q19: What is the mode of action of
Q20: What is the cascade of events that