Multiple Choice
Refer to the information provided in Figure 5.7 below to answer the question(s) that follow. 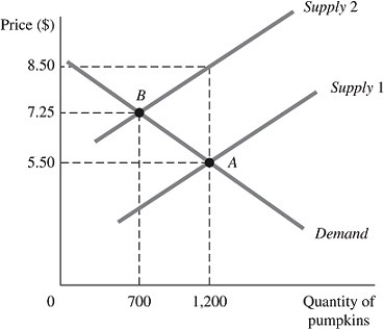 Figure 5.7
The above figure represents the market for pumpkins both before and after the imposition of an excise tax, which is represented by the shift of the supply curve.
-Refer to Figure 5.7. Before the tax, store owners are willing to sell ________ pumpkins at a price of ________ each.
A) 1,200; $5.50
B) 700; $7.25
C) 0; $8.50
D) 1,200; $8.50
Correct Answer:

Verified
Correct Answer:
Verified
Q145: When demand is unit elastic, an increase
Q146: The price elasticity of demand for heart
Q147: A government wants to reduce electricity consumption
Q148: A tax on a good whose demand
Q149: Demand is more elastic for an item
Q151: When demand is elastic, a decrease in
Q152: Total revenue increases if price _ and
Q153: Related to the Economics in Practice on
Q154: An increase in demand caused no change
Q155: When demand is unit elastic, a change