Multiple Choice
Refer to the information provided in Figure 3.7 below to answer the following question(s) . 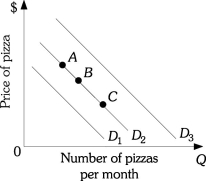 Figure 3.7
-Refer to Figure 3.7. A movement from Point A to Point B on demand curve D2 would be caused by a(n)
A) decrease in income, assuming pizza is a normal good.
B) decrease in the price of burritos, assuming that pizza and burritos are substitutes.
C) decrease in the price of pizza.
D) increase in the price of pizza.
Correct Answer:

Verified
Correct Answer:
Verified
Q69: Refer to the information provided in Figure
Q70: Refer to the information provided in Figure
Q71: Refer to the information provided in Figure
Q72: Refer to the information provided in
Q73: Refer to the information provided in Figure
Q75: As an individual consumes more of a
Q76: Refer to the information provided in Figure
Q77: If increases in government regulations have increased
Q78: Refer to Scenario 3.1 below to answer
Q79: Refer to the information provided in Figure