Multiple Choice
Refer to the information provided in Figure 3.12 below to answer the question(s) that follow. 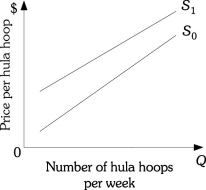 Figure 3.12
-Refer to Figure 3.12. The supply curve for hula hoops shifts from S1 to S0. This could be caused by
A) a decrease in the price of hula hoops.
B) a decrease in the number of firms selling hula hoops.
C) a decrease in the demand for hula hoops.
D) a decrease in the cost of producing hula hoops.
Correct Answer:

Verified
Correct Answer:
Verified
Q282: When there is an excess supply of
Q283: Wealth is a flow measure.
Q284: Refer to the information provided in Figure
Q285: Refer to the information provided in Figure
Q286: The quantity demanded of Pepsi has decreased.
Q288: All households have ultimately limited incomes.
Q289: Refer to the information provided in Figure
Q290: Quantity demanded of a product is determined
Q291: Households are paid income for the resources
Q292: Refer to Scenario 3.3 below to answer