Multiple Choice
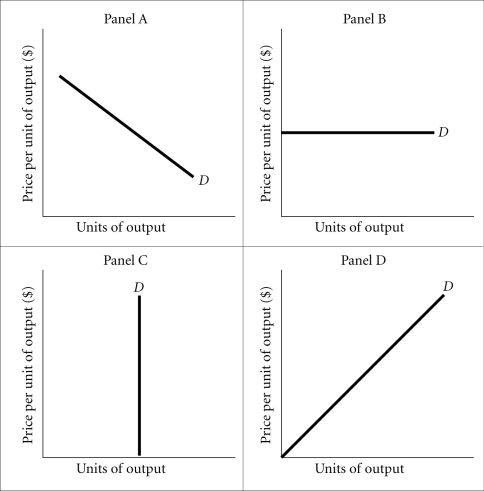
Refer to the information provided in Figure 13.1 below to answer the question that follows.  Figure 13.1
-Refer to Figure 13.1. Of the following choices, Panel A best represents the demand curve for
A) an individual producer of soybeans.
B) a utility company.
C) insulin.
D) none of the above
Correct Answer:

Verified
Correct Answer:
Verified
Q212: When _ substitutes exist, a monopolist has
Q213: Refer to the information provided in Figure
Q214: Refer to the information provided in Figure
Q215: Refer to the information provided in Figure
Q216: A monopolistic firm faces a continuously downward-sloping
Q218: A monopoly is an industry with a
Q219: An industry that realizes such large economies
Q220: For a monopoly, the marginal revenue curve
Q221: Refer to the information provided in Figure
Q222: Suppose we know that a monopolist is