Essay
The following diagram shows three Lorenz curves for the country of Ecoland. Based on this diagram, describe what happened to the distribution of income in Ecoland between 1956 and 20. What happened to the Gini Coefficient? 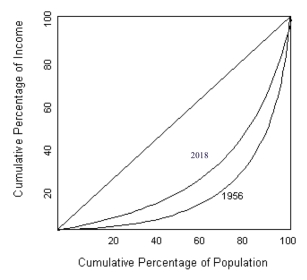
Correct Answer:

Verified
The diagram shows that between 1956 and ...View Answer
Unlock this answer now
Get Access to more Verified Answers free of charge
Correct Answer:
Verified
View Answer
Unlock this answer now
Get Access to more Verified Answers free of charge
Q5: How does the Lorenz curve for the
Q6: "To eliminate poverty, all we need to
Q7: What is the distributive effect of the
Q8: Which of the three types of tax
Q9: What does it mean if the gap
Q11: Describe the difference between share distribution of
Q12: What are the distributive consequences of the
Q13: Some people in the U.S. argue that
Q14: How does the distribution of income compare
Q15: What are the distributive consequences of each