Essay
The following diagram shows three Lorenz curves for countries A, B, and C. The area between the Lorenz curve and the diagonal is 1,000 for Country A, 2,000 for Country B, and 2,500 for Country C. (The entire area under the diagonal is 5,000 because the area of the triangle is ½ × (base × height) = ½ × (100 × 100) = 5,000.)
(1) Calculate the Gini coefficient for each country.
(2) Based on the Gini coefficient, which country has the most equal distribution of income? Which country has the least? 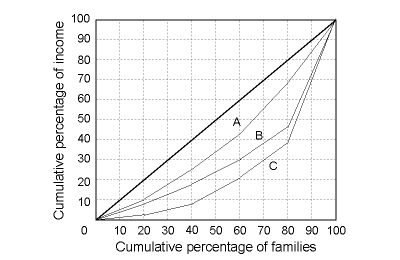
Correct Answer:

Verified
(1) The Gini coefficient equals 1,000/5,...View Answer
Unlock this answer now
Get Access to more Verified Answers free of charge
Correct Answer:
Verified
View Answer
Unlock this answer now
Get Access to more Verified Answers free of charge
Q24: Is an equal distribution of income always
Q25: Explain the difference between wealth and income.
Q26: One way to look at inequality is
Q27: What are three negative side effects of
Q28: The text discusses ten expenditure programs used
Q29: In some countries the tax system is
Q30: What is the Gini coefficient, and what
Q31: Philosopher John Rawls generally argued for greater
Q33: Economists often use a Lorenz curve to
Q34: Give three reasons why an equal distribution