Essay
The diagram was intended to illustrate the MP and AP curves that correspond to each other. Explain why the diagram below is incorrect. 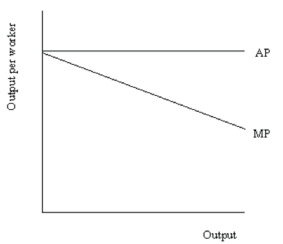
Correct Answer:

Verified
If the marginal product (MP) is below av...View Answer
Unlock this answer now
Get Access to more Verified Answers free of charge
Correct Answer:
Verified
If the marginal product (MP) is below av...
View Answer
Unlock this answer now
Get Access to more Verified Answers free of charge
Related Questions
Q23: Why do most firms operate at output
Q24: Define variable cost. What sorts of things
Q25: Why does the marginal cost curve always
Q26: The diagram below shows the production
Q27: Give the definition of fixed cost. What
Q29: What is the distinction between the microeconomic
Q30: Why are the MC and AVC curves
Q31: What is the law of diminishing marginal
Q32: How is accounting profit different from economic
Q33: Draw and correctly label a typical set