Essay
Consider the following supply table, which represents the supply of comic books by Bill, Judy, and Sally. (a) Fill in the "market supply" column of the above table.
(b) Use the grid below to draw the supply curves for comic books of Bill, Judy, and Sally. Then draw in the market supply curve. 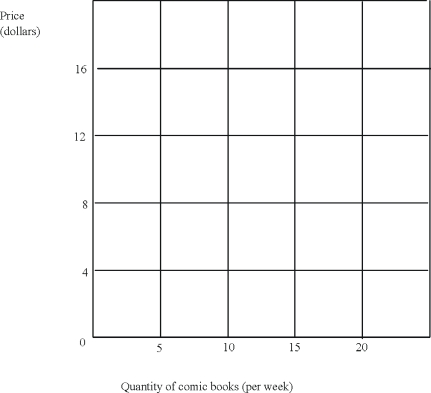 (c) Compare the supply curve you have drawn for Sally and Judy. Which of these two is more influenced by increases in the price of comic books? Explain.
Correct Answer:

Verified
(a) To fill in the "market supply" colum...View Answer
Unlock this answer now
Get Access to more Verified Answers free of charge
Correct Answer:
Verified
View Answer
Unlock this answer now
Get Access to more Verified Answers free of charge
Q16: John and Steve are roommates at Siberian
Q17: Demonstrate graphically and explain verbally the concept
Q18: Demonstrate graphically and explain the difference between
Q19: How is the "Law of Demand" different
Q20: Stuffed-Crust Pizza is a new pizza introduced
Q22: Consider the following supply and demand diagram
Q23: Demonstrate graphically and explain verbally the concept
Q24: Demonstrate graphically and explain the difference between
Q25: The diagram below represents the consumer side
Q26: What is equilibrium? Explain what it means