Essay
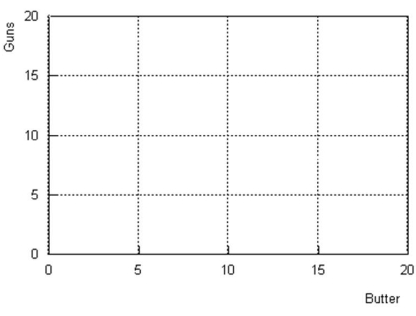
The table below is a production possibility table for the fictional country of Myopia. Use it to construct the corresponding production possibility curve in the quadrant below. (Label the axes.) 
(a) Explain the meaning of a production possibilities curve.
(b) What is assumed to be constant when we draw that curve?
(c) How is a point on the curve different from (1) a point inside the curve or (2) a point outside the curve?
(d) How does this curve illustrate the concept of opportunity cost?
(e) How does it illustrate the principle of increasing marginal opportunity cost?
Correct Answer:

Verified
 (a) A production possibilities curve is...
View Answer
Unlock this answer now
Get Access to more Verified Answers free of charge
Correct Answer:
Verified
View Answer
Unlock this answer now
Get Access to more Verified Answers free of charge
Q11: What two lessons can you learn from
Q12: In what way does the notion of
Q13: Consider a farmer's production possibilities curve, with
Q14: Below is a picture of a production
Q15: What does it mean when we say
Q17: What is the argument for laissez faire
Q18: Does the production possibilities curve tell us
Q19: Draw a production possibilities curve that indicates
Q20: What is a production possibilities curve?
Q21: Why do marginal opportunity costs increase as