Multiple Choice
Refer to the graph shown. A consumer would be expected to change consumption from point A to point B in response to a(n) : 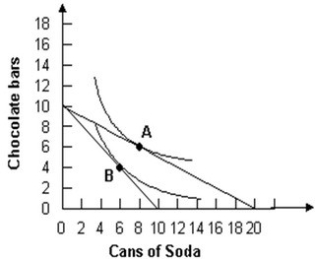
A) increase in the price of soda.
B) increase in the price of chocolate bars.
C) increase in income.
D) decrease in the price of soda.
Correct Answer:

Verified
Correct Answer:
Verified
Q73: Given a fixed level of spending, you
Q74: The following table lists the utility
Q75: Given a set amount of money, goods
Q76: John is maximizing utility by choosing to
Q77: Mike is maximizing utility by working 10
Q79: The principle of diminishing marginal utility states
Q80: The principle of diminishing marginal utility states
Q81: Suppose there is diminishing, but not negative,
Q82: Given that price is constant, the lower
Q83: Refer to the graph shown. <img src="https://d2lvgg3v3hfg70.cloudfront.net/TB7145/.jpg"